In the world of financial markets, traders encounter various challenges that can significantly impact their trading strategies and outcomes. One such challenge is the occurrence of injection candles, which can lead to sudden and extreme price movements within a single candlestick. In this blog post, we will delve into what injection candles are, how they are formed, and their impact on trading.
What are Injection Candles?
Injection candles, also known as freak trades, price spikes or anomalies, are sudden and extreme price movements that occur within a very short period, typically represented by a single candlestick on a price chart. Injection candles are formed due to a rapid influx of buy or sell orders that overwhelm the market’s liquidity, causing prices to surge or plummet within seconds.
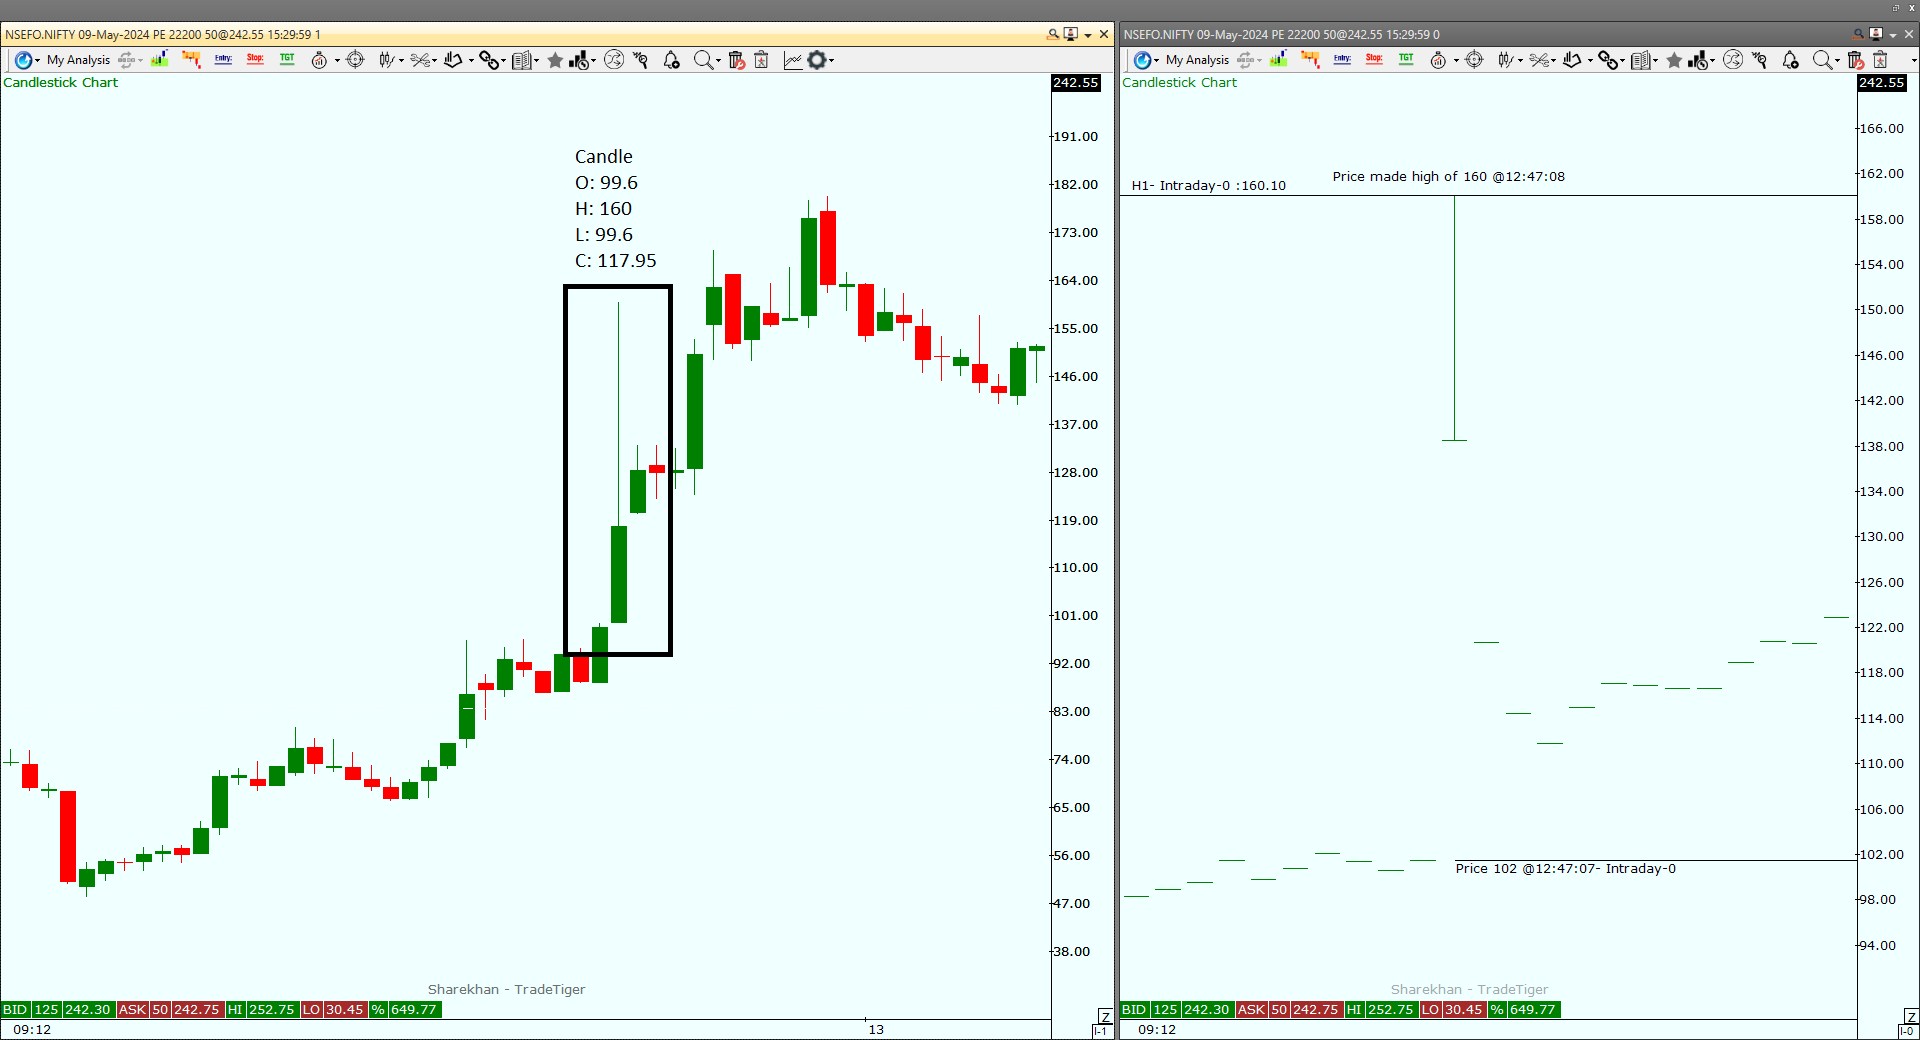
Let’s take a closer look at a real-life example to understand how injection candles impact trading. Above is the chart for Nifty 22000 PE 09-05-2024 expiry. On the left side, it’s a minute OHLC candlestick chart, and on the right side, it’s a raw tick data chart. The candle market opened at 12:47:00 and closed at 12:48:00. The candle’s open was 99.6 and made a high of 160, then again came down and closed at 117.95.
If you examine the raw tick data on the right side, you’ll notice that the price was at 102 @12:47:07 and 160 @12:47:08. Although there may have been numerous trades occurring between 102 and 160, the tick data chart displays only these two ticks. This limitation arises from technological challenges, as not all tick data is captured by brokers. Additionally, most platforms only show one tick per second on their charting platform. Regarding APIs, brokers typically send around 1 to 4 ticks per second. Consequently, we often observe similar price jumps from 102 to 160, depending on the data captured and relayed through the broker’s API. Understanding this limitation is crucial for grasping how it impacts the execution of any algorithmic software developed by Algo Trading providers.
There have been many instances of such crazy spikes occurring for a long time, especially for put options, which have led to traders experiencing significant slippage.
Let’s understand how it impacts your trading especially when you are using any Algo Software:
When placing the SL order in the broker
When you place an SL order with a broker, such as in the above example where the price jumped from 102 to 160 in just one second, there are uncertainties regarding whether your SL order will be filled. Let’s say you had placed an SL order with a trigger price of 115 and a limit price of 125. In the event of such significant spikes occurring within just one second, your SL order may or may not get filled. If your order’s turn comes up in the exchange’s order-matching mechanism, then you may get a fill. However, if your order doesn’t come up due to low liquidity, it will be left open. If you attempt to manually modify the order or if your algo software modifies the order to secure a fill, you may get slippage.
When you don’t place the SL order in the broker
In the scenario described, if your SL is set at 115 and your algo is actively monitoring the price, triggering an order to exit as soon as the price surpasses 115, you’re likely to encounter slippage. Even with a very high response time of around 10 milliseconds, if the price has already jumped from 102 to 160, the order executed at 160 will result in slippage when exiting.
When you are setting MTM based exit rules.
Let’s consider a scenario where you’ve set a maximum loss of 1 lakh rupees and you’ve sold 2500 quantities of the put option at 90 rupees. When the price is at 102, your MTM loss is 30,000. However, with the immediate next tick jumping to 160, your MTM loss shoots up to 1,75,000. Because your MTM loss isn’t gradually increasing but rather experiencing a sudden spike between two ticks, your exit will occur at a level far above your desired maximum loss of 1 lakh rupees. This limitation isn’t inherent to the algo software itself but stems from the constraints of technology and the data being relayed through the API.
To wrap it up, it’s essential to grasp that the heart of the issue lies in how prices can unexpectedly surge or drop within the blink of an eye. By recognizing these challenges, traders can better navigate the unpredictable nature of the market and adjust their tactics accordingly for more effective trading.
Disclaimer: All data and information provided in this article are for informational purposes only. Myalgomate® makes no representations as to the accuracy, completeness, correctness, suitability, or validity of any information in this article and will not be liable for any errors, omissions, or delays in this information or any losses, injuries, or damages arising from its display or use. All information is provided on an as-is basis.
References:
- Injection Candle
- Stoploss order not executed
- Limitations of the technology
- What are the stoploss orders?
- Why stoploss order triggered without trigger price being hit as per the charts?


1 Comment
Anshree
July 30, 2024Great article